Home > PUBLICATIONS > Market Watch >
Market Watch
-
Nepal mVAM Market Bulletin #12017-11-01
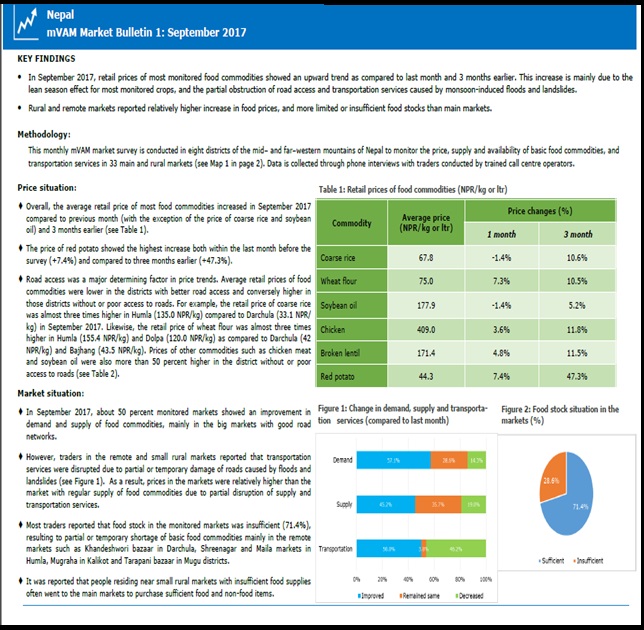
In September 2017, retail prices of most monitored food commodities showed an upward trend as compared to last month and 3 months earlier. This increase is mainly due to the lean season effect for most monitored crops, and the partial obstruction of road access and transportation services caused by monsoon-induced floods and landslides.
Rural and remote markets reported relatively higher increase in food prices, and more limited or insufficient food stocks than main markets. -
Market Watch 862017-06-05
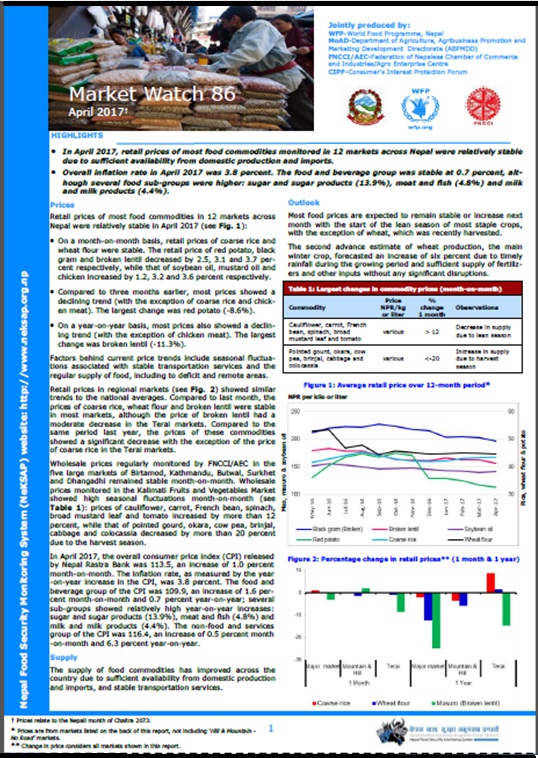
In April 2017, retail prices of most food commodities monitored in 12 markets across Nepal were relatively stable due to sufficient availability from domestic production and imports.
Overall inflation rate in April 2017 was 3.8 percent. The food and beverage group was stable at 0.7 percent, although several food sub-groups were higher: sugar and sugar products (13.9%), meat and fish (4.8%) and milk and milk products (4.4%). -
Market Watch 852017-02-28

In January 2017, retail prices of most food commodities monitored in 12 markets across Nepal were stable (or declined) due to the improved supply of food from the summer crop harvest and stable transportation services.
Overall inflation rate in January 2017 was 3.2 percent. The food and beverage group was at -0.7 percent. Several food sub-groups were higher: sugar and sugar products (15.0 percent), spices (5.8 percent) and milk and milk products (2.9 percent). -
Market Watch 842017-01-11
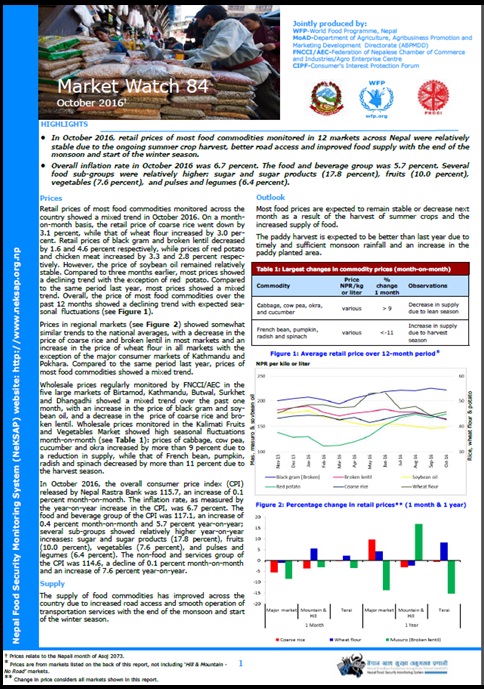
In October 2016, retail prices of most food commodities monitored in 12 markets across Nepal were relatively stable due to the ongoing summer crop harvest, better road access and improved food supply with the end of the monsoon and start of the winter season.
Overall inflation rate in October 2016 was 6.7 percent. The food and beverage group was 5.7 percent. Several food sub-groups were relatively higher: sugar and sugar products (17.8 percent), fruits (10.0 percent), vegetables (7.6 percent), and pulses and legumes (6.4 percent).
News & Events
- Brief on the Food Security Situation in Nepal (Mid-July to mid-November 2017)
- Launch of Food Security Information System for Nepal
- Second Advance Estimate of 2016/17 Wheat Production in Nepal using CRAFT
- Brief on the food security situation in Nepal (Mid November 2016 to Mid March 2017)
- Updated NeKSAP guidance on food security response analysis and district food security monitoring
Latest PublicationsView All
-
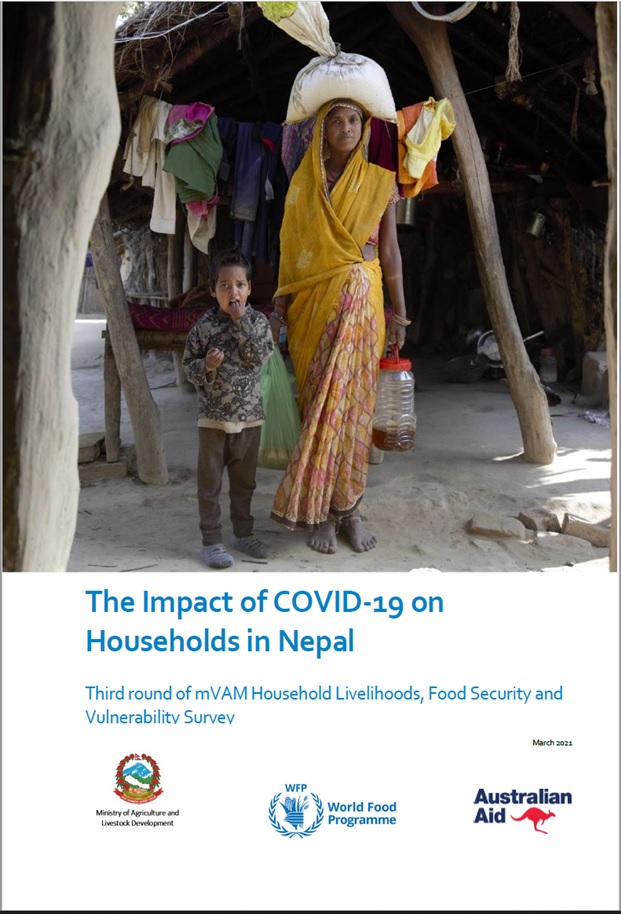
The Impact of COVID-19 on Household Food Security, Livelihoods and Vulnerability in Nepal-3
-
The Impact of COVID-19 on Household Food Security, Livelihoods and Vulnerability in Nepal-2